WebFOCUS Online Help > Managed Reporting End User > Using Power Painter > Using Power Painter Objects
The available objects in Power Painter are Report, Graph, Image, Text, and Line. You can select these objects from the Toolbox palette or use the Insert menu on the main toolbar. Each object is associated with corresponding properties that you can set using the properties palette for the selected object.
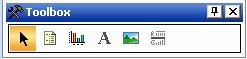
The following image shows the Toolbox palette displaying the Report, Graph, Image, Text, and Line object buttons.
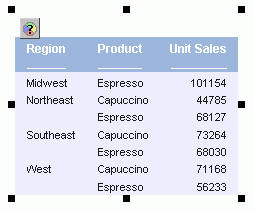
The selected object appears with black squares around the perimeter of the object, as shown in the following image.
Numeric fields, such as decimal and floating point, are automatically added to the Sum folder. Non-numeric fields, such as alphanumeric and date fields, are automatically added to the By folder.
 button, which is located above
the top left corner of the selected report object.
button, which is located above
the top left corner of the selected report object.
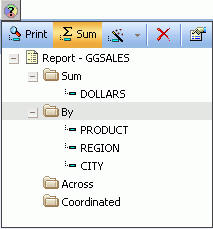
The Query pop-up dialog box opens, as shown in the following image.
Continue to drag the field and drop it on the Sum, By, Across, or Coordinated folder.
Note: By and Across folders are for sorting, Sum folders are for aggregating and displaying, and Coordinated folders contain a common sort field for creating multiple reports and graphs that are burst into separate page layouts. Each value for a coordinated sort field displays on a separate page.
The By, Sum, Across, and Coordinated folders appear with the selected fields in the report. You can drag and drop fields into different folders, delete fields, add and edit compute fields, and view report properties for a selected field. You can also select Print to display all of the values found in the data source for a selected field, or select Sum to sum the values of a selected numeric field.
For details, see Field Properties.
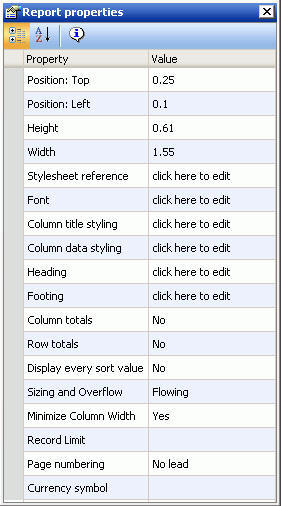
When a report object is selected, the following properties are available from the Report properties palette.
Indicates the starting position for the top edge of the report. You can type in a different value to change the position or manually drag the report on the canvas.
Indicates the starting position for the left edge of the report. You can type in a different value to change the position or manually drag the report on the canvas.
Indicates the height of the report object. You can type in a different value to change the height or manually drag the report object on the canvas.
Indicates the width of the report object. You can type in a different value to change the width or manually drag the report object on the canvas.
Click the browse (...) button to select an external stylesheet. The report references the selected stylesheet which controls the global level styling of the report. You can choose from a predefined set of stylesheets, or a stylesheet from the Import directory.
Shows the default global font for the report.
Click the browse (...) button to open the font dialog box. Select the font, style, size, text, and background color for the column titles in the report.
Click the browse (...) button to open the font dialog box. Select the font, style, size, text, and multiple background colors for the data in the report.
Adds a heading to the report. Click the browse (...) button to open the Heading dialog box.
Adds a footing to the report. Click the browse (...) button to open the Footing dialog box.
Shows columns totals in the report. No is selected by default. To show column totals, use the drop-down list to select Yes.
Shows row totals in the report. No is selected by default. To show row totals, use the drop-down list to select Yes.
Determines when all instances of a vertical sort (By) field are displayed in the report. No is selected by default to omit duplicates. To display every instance of a vertical sort field value, use the drop-down list to select Yes.
Determines the vertical sizing of the report by setting fixed or flowing overflow. For more information about sizing and overflow, see Setting Overflow Options in Power Painter.
Shrinks the column width to fit the widest value in the report. Yes is selected by default. Select No from the drop-down list to expand all of the columns.
Limits the number of records used to retrieve data at run time.
Select On, Off, or No lead from the list box.
Overrides the default currency symbol for the reporting server. Use the drop-down list to select from Default, USD, GBP, JPY, EUR, or $. You can also type a one-character custom symbol directly in the value column adjacent to the Currency symbol property.
When you right-click a report object, the following options are available from the dialog box that appears:
Opens the query dialog box.
Resizes the report as fields are added and deleted.
Deletes the report.
Displays the Report properties dialog box.
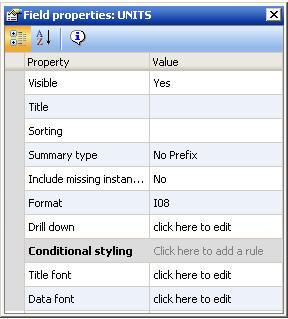
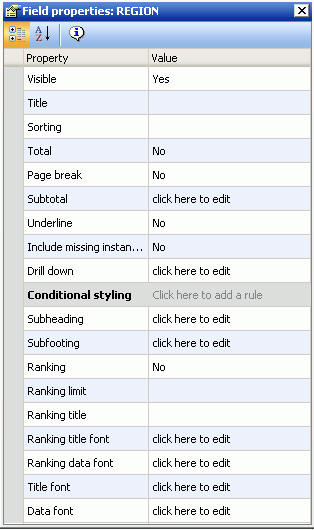
When a report is selected, the following properties are available from the Field properties palette.
Note: The field properties available vary depending on the type of sort field selected.
Controls whether a field appears in the report graph, or is hidden. If Visible is set to No, the column is hidden, but is still used in calculations.
Enables you to enter a title for the field in the report graph.
Sorts the column data in ascending or descending order.
Starts a new page when the value of a selected sort field changes.
Enables you to display subtotals for numeric data whenever the value of the selected sort (By) field changes. By default, numeric field values are summed and displayed as subtotals. Additionally, you can display other summary values by applying prefix operators to numeric fields, including computed fields, by clicking the browse (...) button to open the Sub Total Options dialog box. For more information, see How to Display Subtotals and Other Summary Values Using Prefix Operators.
Includes a horizontal line across the width of a report after the value of the selected sort field changes.
Displays missing instances of data for related fields in the report.
Enables you to supply information to another report by using a hyperlink, procedure, or parameter.
Enables you to assign a conditional style to a report element. Conditional styling enables you to define conditions that determine when to apply particular fonts, text style, and so on. For more information about conditional styling, see How to Create Conditional Styling Rules.
Adds a subheading to the report at sort breaks. Click the browse (...) button to open the subheading dialog box.
Adds a subfooting to the report at sort breaks. Click the browse (...) button to open the subfooting dialog box.
Includes a column with a numeric rank for each row in a vertically sorted report.
If specified, this value limits the number of ranked values to be retrieved.
Displays a default column title as RANK with the sort field. You can type in a unique title name for the ranked field.
Click the browse (...) button to open the font dialog box. Select the font, style, and size for the ranking title.
Click the browse (...) button to open the font dialog box. Select the font, style, and size for the ranking data.
Click the browse (...) button to open the font dialog box. Select the font, style, size, text and multiple background colors for the column title.
Click the browse (...) button to open the font dialog box. Select the font, style, size, text and multiple background colors for the data column.
Enables you to generate a Table of Contents (TOC) page which shows a summary of the document's contents, along with page numbers, and can be printed with the document. The entries in the Table of Contents enable you to easily navigate to a particular section while viewing the document.
Note: The Table of Contents only appears as a field option if you are using a coordinated report.
or
Select Graph from the Insert menu.
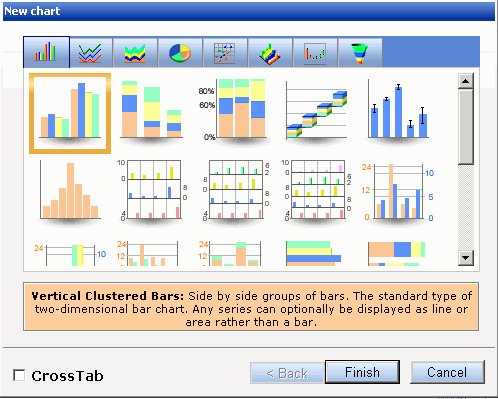
The New Chart dialog box appears.
The graph appears on the canvas.
Tip: To view the New Chart dialog box after the graph has been added to the canvas, select Show Chart Types from the right-click context menu of the graph.
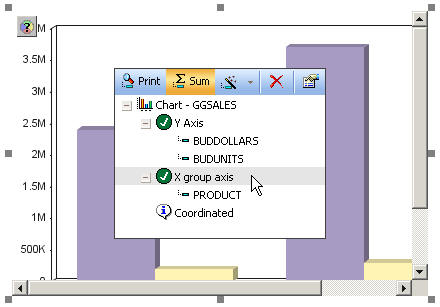
When you drag a field into the graph, drop the field on the Y axis, X group axis, Coordinated, or other specialized field container in the Query pop-up dialog box that appears, as shown in the following image.
You can also double-click a field to automatically add it to the graph. Numeric fields, such as decimal and floating point, are added to the Y axis (or other specialized) container. Non-numeric fields, such as alphanumeric and date fields, are added to the X group axis (or other specialized) container.
Note: The Coordinated field container contains a common sort field for creating multiple reports and graphs that are burst into separate page layouts. Each value for a coordinated sort field displays on a separate page.
The Y axis, X group axis, and Coordinated field containers appear with the selected fields in the graph. Note that some specialized graphs have other field containers. You can drag and drop fields into different containers, delete fields, add and edit compute fields, and view properties for a selected field from this dialog box. You can also select Print to display all of the values found in the data source for a selected field, or select Sum to sum the values of a selected numeric field.
For most chart types, when a graph object is selected, the following properties are available from the Chart properties palette. Note: Some chart types with unique properties, such as pie and three dimensional charts, have specialized properties not shown below.
Select from Yes or No. Displays the Series-legend icon and enables secondary X-axis functionality.
Type a number to edit the record limit value.
Indicates the starting position for the top edge of the graph. You can type in a different value to change the position or manually drag the graph on the canvas.
Indicates the starting position for the left edge of the graph. You can type in a different value to change the position or manually drag the graph on the canvas.
Indicates the height of the graph object. You can type in a different value to change the height or manually drag the graph object on the canvas.
Indicates the width of the graph object. You can type in a different value to change the width or manually drag the graph object on the canvas.
Select from any of the available templates to apply a predefined color scheme to change the appearance of your chart.
Type the desired title text.
Type the desired subtitle text.
Type the desired footnote text.
Select from Yes or No to apply or not apply a three dimensional effect on the graph.
Select the desired option for positioning the chart's legend.
Select from Yes or No to display or not display data values on the graph.
Select from Yes or No to display or not display X-axis major gridlines on the graph.
Select from Yes or No to display or not display Y-axis major gridlines on the graph.
Select from Yes or No to turn auto placement on or off.
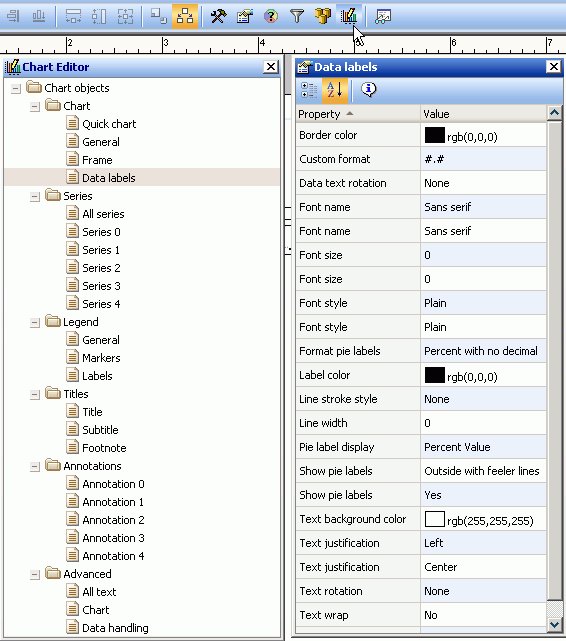
When the Chart Editor dialog box is open in Power Painter, properties are available for each object in the chart editor. The following image is an example of the Chart Editor and the Data labels properties palette in Power Painter.
For details about the chart editor and its object properties, see the Creating Graphs With Advanced Graph Assistant chapter in the WebFOCUS Managed Reporting Developer's Manual.
or
Select Text from the Insert menu.
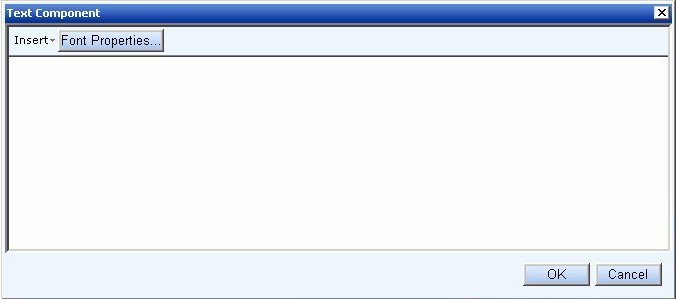
The Text Component dialog box appears on the canvas.
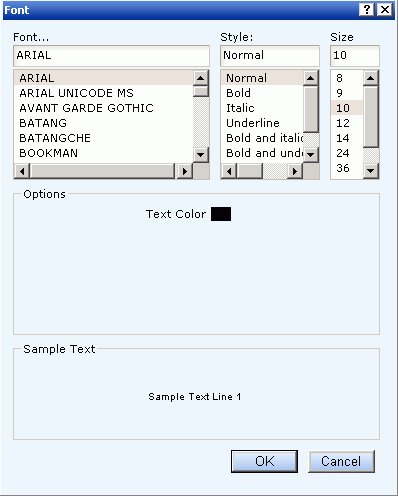
You can customize the font, style, size, and text color of the text.
The text is inserted into the canvas.
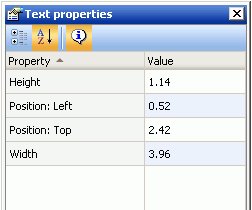
When a text object is selected, the following properties are available from the Text properties palette.
Indicates the height of the text object. You can type in a different value to change the height or manually drag the text object on the canvas.
Indicates the starting position for the left edge of the text.
Indicates the starting position for the top edge of the text.
Indicates the width of the text object. You can type in a different value to change the width or manually drag the text object on the canvas.
or
Select Image from the Insert menu.
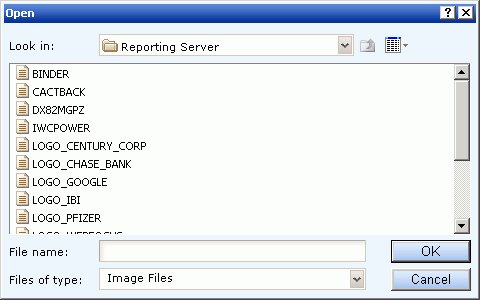
The Open dialog box appears on the canvas.
Note: The Reporting Server is the default location for all stored images.
Images need to be copied to the appropriate directories by your administrator.
When you right-click an image, the following options are available from the dialog box that appears:
Resets the image to the original size.
Deletes the image.
Opens the Image properties dialog box.
Note: Hover over an image to view the file name.
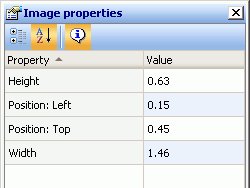
When an image object is selected, the following properties are available from the Image properties palette.
Indicates the height of the image object. You can type in a different value to change the height or manually drag the image object on the canvas.
Indicates the starting position for the left edge of the image.
Indicates the starting position for the top edge of the image.
Indicates the width of the image object. You can type in a different value to change the width or manually drag the image object on the canvas.
or
Select Line from the Insert menu.
The line object is added to the canvas as a positioned horizontal line.
Note: To insert a vertical line, use the Line properties palette to change the orientation to vertical.
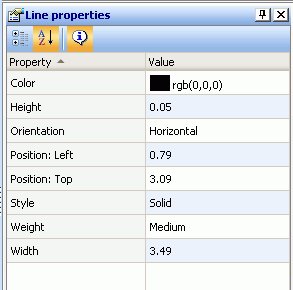
When a line object is selected, the following properties are available from the Line properties palette.
Sets the color of the line. Click in the color value field to open the color dialog box.
Indicates the height of the line object. You can type in a different value to change the height or manually drag the line object on the canvas.
Indicates the horizontal or vertical orientation of the line on the canvas.
Indicates the starting position for the left edge of the line.
Sets the style of the line. Use the drop-down list to select from solid, dotted, dashed, and so on.
Sets the thickness of the line to light, medium, or heavy.
Indicates the width of the line object. You can type in a different value to change the width or manually drag the line object on the canvas.
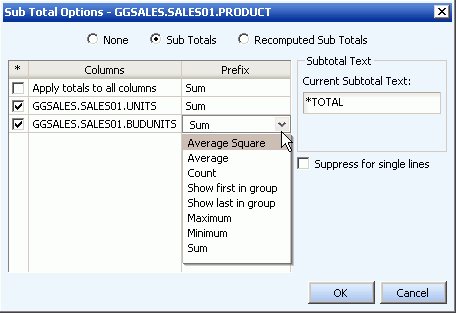
The Subtotal property in the Field properties palette enables you to display subtotals, and other summary values using prefix operators, for any or all of the numeric fields, including computed fields, in a report query. From the Field Properties dialog, when you click the browse (...) button to the right of the Subtotals property, the Sub Total Options dialog box opens.
If you are using computed fields, select the Recomputed Sub Totals option instead.
All of the available prefix operators are listed and described in the following table.
|
Prefix |
Description |
Displayed in Prefix List |
|---|---|---|
| SUM. | Compute the sum of values | Sum |
| ASQ. | Compute the average sum of squares | Average Square |
| AVE. | Compute the average value | Average |
| CNT. | Count the items | Count |
| FST. | Select the first value only | Show first in group |
| LST. | Select the last value only | Show last in group |
| MAX. | Select the maximum value only | Maximum |
| MIN. | Select the minimum value only | Minimum |
When Apply totals to all columns is selected, options for all individual fields in the Columns area are inactive by default.
The following image shows the Sub Total Options dialog box.
| WebFOCUS |