WebFOCUS
Online Help > Managed Reporting End User > Using Power Painter > Controlling the Overflow and Relative Positioning of Objects in Power Painter
Controlling the Overflow and Relative Positioning of Objects in Power Painter
In Power Painter, you can control the overflow of reports,
and relative vertical positioning of reports and graphs, so they
fill an entire page and maintain their relative positions in the
document. The Sizing and Overflow property in the Report properties palette
is used to control overflow and relative positioning.
Overflow is defined as the area of a report that exceeds its
defined space in the page layout. For example, a multi-page report
and a graph can both be added to a single page layout with the graph
positioned beneath the report. The report can flow to fill the page
and the graph can be relatively positioned to the report so it is
placed at the end of the document following the complete rendering
of the report.
Note: There is currently no method of controlling horizontal overflow.
Setting Overflow Options in Power Painter
When executing a report, the area that flows outside
of the allocated space for the report is considered the overflow.
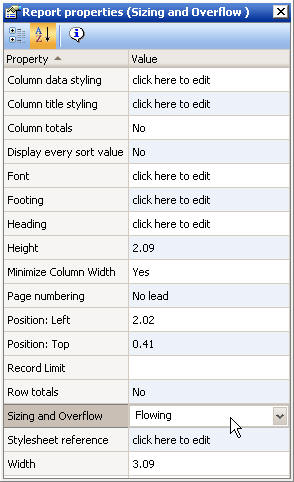
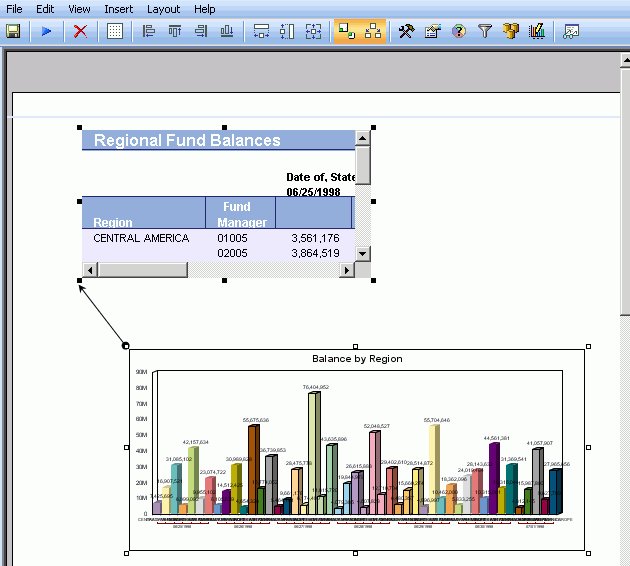
The following image is an example of the canvas in Power Painter.
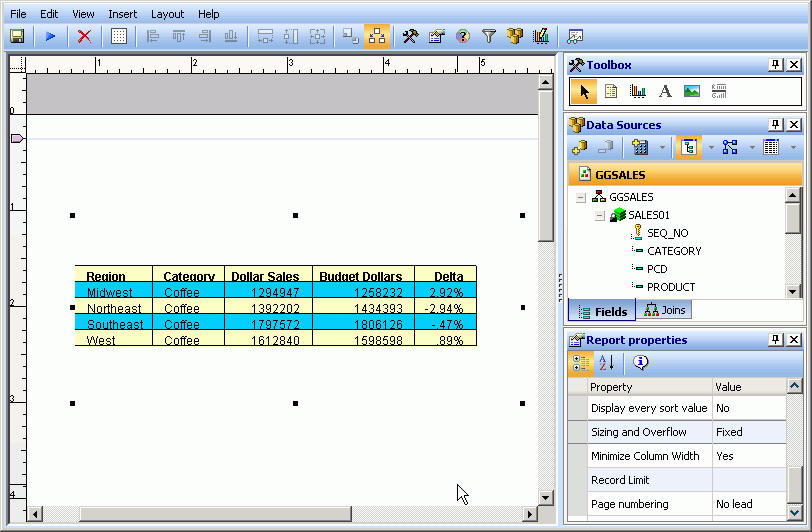
You can set the size and overflow of a report object to control
the overflow at run time. Sizing and overflow options are available
through the Report properties palette.
-
Fixed. When
Sizing and Overflow is set to Fixed, the report is confined to the
dimensions of the canvas at run time and continues to output on multiple
pages within the same fixed dimensions until all of the data is
shown.
-
Flowing. When
Sizing and Overflow is set to Flowing, the report fills the page
at run time and automatically pushes surrounding objects down the
page until the report is finished. This enables other objects such
as repeating images and text (headers and footers) to be shown and
not overlapped by the flowing report.
Note: These options only apply to report objects. There
are no size and overflow properties for graphs, images, text, or
lines.
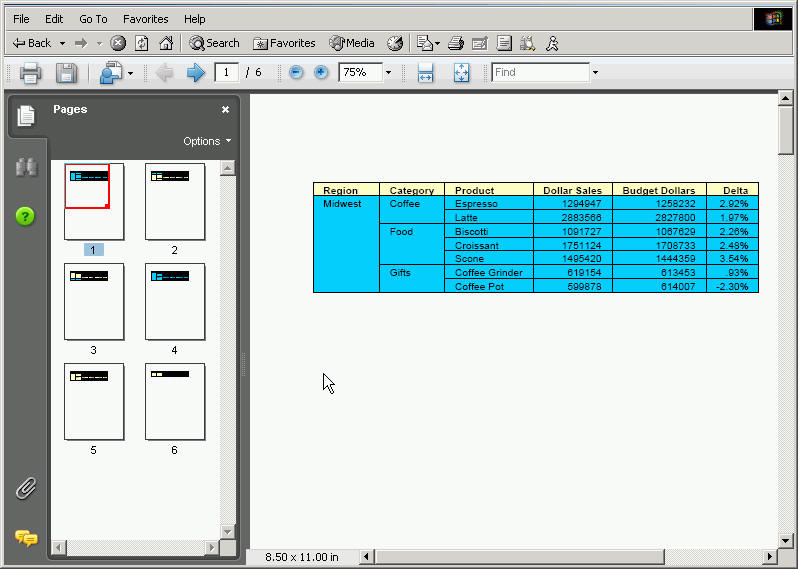
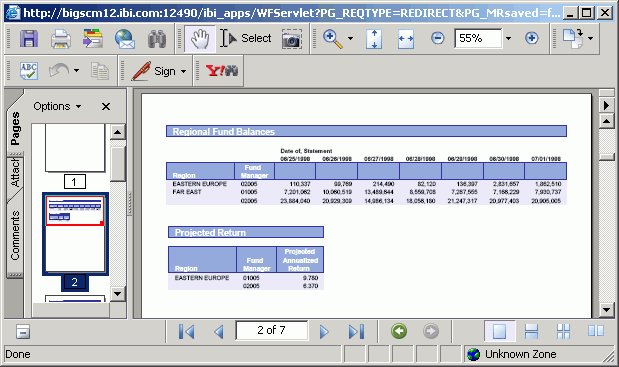
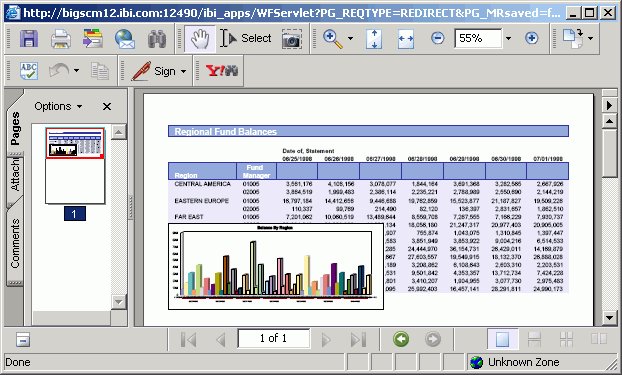
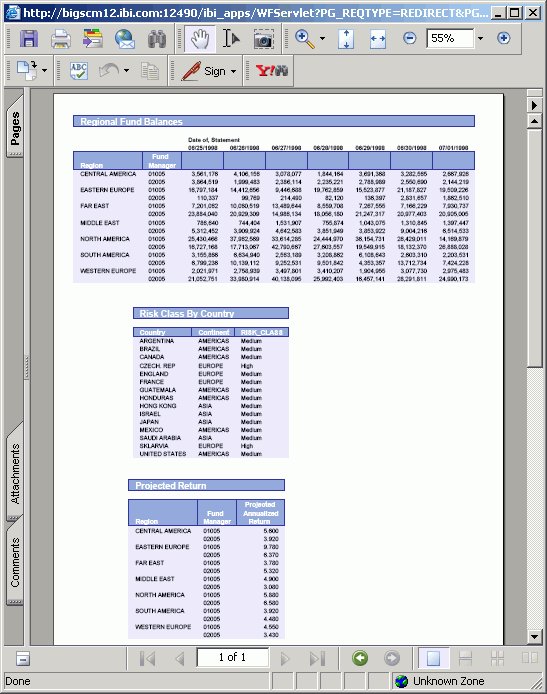
The following image is an example of a report with Sizing and
Overflow set to Fixed. Note how the report output maintains the
size of the report object in the Power Painter canvas, spreading
the report across 6 pages.
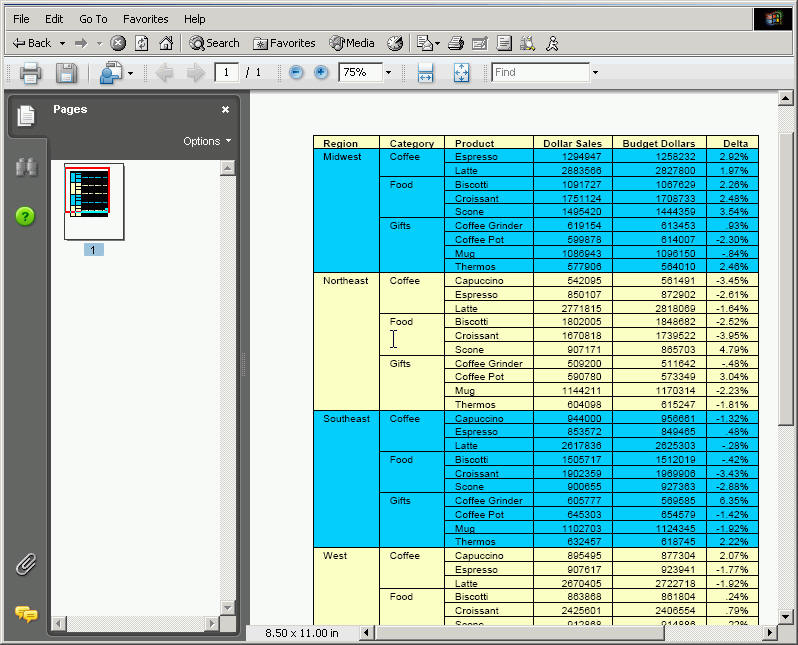
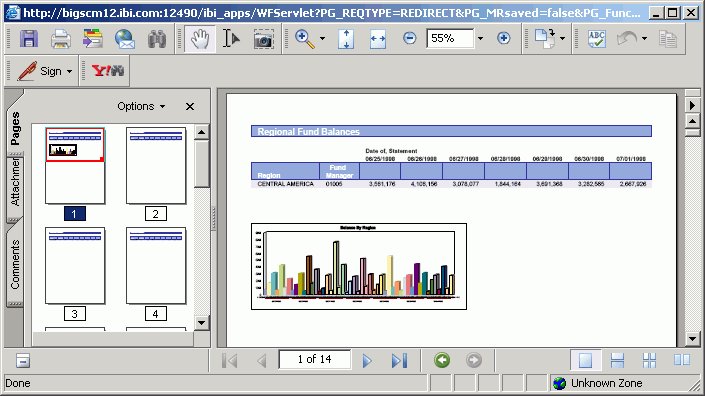
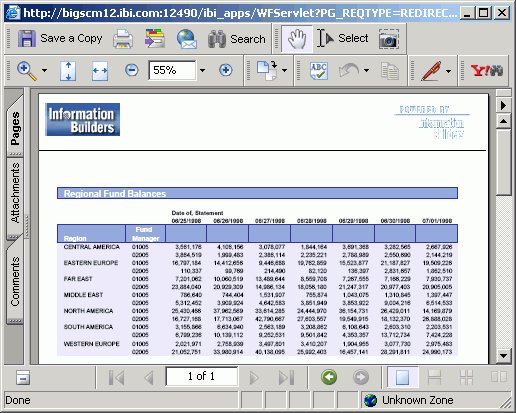
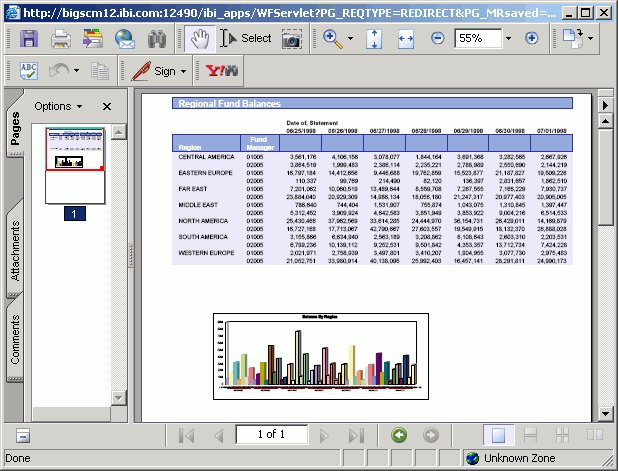
The following image is the same report with Sizing and Overflow
set to Flowing. Note how the report expands to fill the page at
run time.
Using Fixed Overflow in Power Painter
Reports using fixed overflow maintain the size and position
of the report object from the Power Painter canvas in the report
output. You can customize and maintain the fixed position of the
report output by adjusting the position and size options from the Report
properties palette.
Procedure: How to Customize the Fixed Position and Size of an Object
-
Select an object from the Power Painter canvas.
The Report
properties palette shows the available properties for the selected
object.
-
Select Fixed from
the Sizing and Overflow drop-down list.
-
To adjust
the position and size of the object at run time, edit the Position
Left, Position Top, Height, and Width properties in the Report properties palette.
or
To adjust the position, hover the mouse pointer
over the object until a four-way arrow appears, then click and drag
the object in any direction. To adjust the size, hover the mouse
pointer over any of the square corners or midpoints along the border
of the object until a two-way arrow appears, then click and drag
the square in any direction.
-
Run
the report.
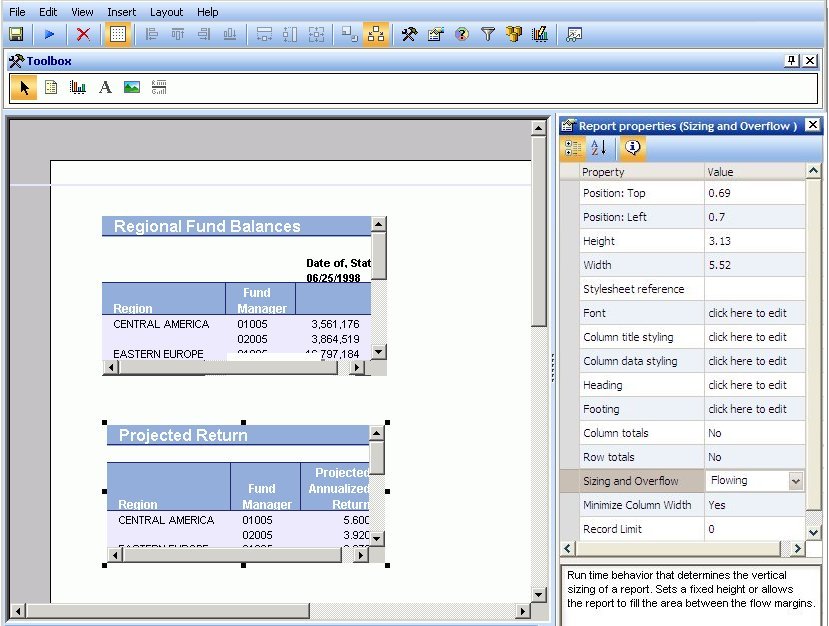
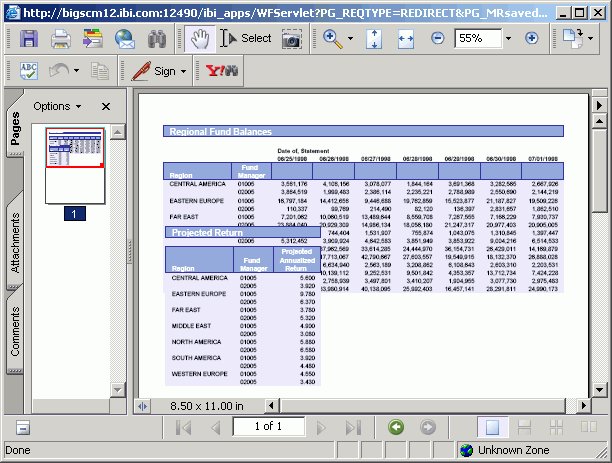
Note: If
the document contains multiple fixed reports, the report output
maintains the same size and position as the report objects in the
Power Painter canvas, as shown in the image below.
Note: If
the document contains a fixed report and a graph, the report may
be broken up around the graph object. You can set the relationship
between the graph and the report to have the graph display after
the report. For more information about setting relationships, see How to Relate Surrounding Objects to a Report.
Using Flowing Overflow in Power Painter
Reports using flowing overflow begin the report output
at the upper left corner of the report object and fill the page
with the report results. Flow margins are available which enable
you to adjust the canvas so that flowing objects fill the page.
Note: Flowing overflow is not available for graphs, images,
text, or lines. For example, if a graph is included in the document
and the graph overlaps the report at run time, you must set a relationship
between the graph and the report so the graph flows after the report
at run time.
Procedure: How to Set the Flowing Report Property
-
Select an object from the Power Painter canvas.
The properties
palette shows the available properties for the selected object.
-
Select Flowing from
the Sizing and Overflow drop-down list.
Tip: Flow margins are available for the canvas which
further enable you to adjust the page so that the report fills each
page between the flow margins. For more information about flow margins,
see How to Set Flow Margins for the Power Painter Canvas.
-
Run
the document.
Note: If
the document contains multiple flowing reports and the reports overlap
at run time, you must set the relationship between the reports.
For more information about setting relationships, see How to Relate Surrounding Objects to a Report.
Note: If
the document contains a flowing report and a graph, and the graph overlaps
the report at run time, you must set the relationship between the
graph and the report. For more information, see How to Relate Surrounding Objects to a Report.
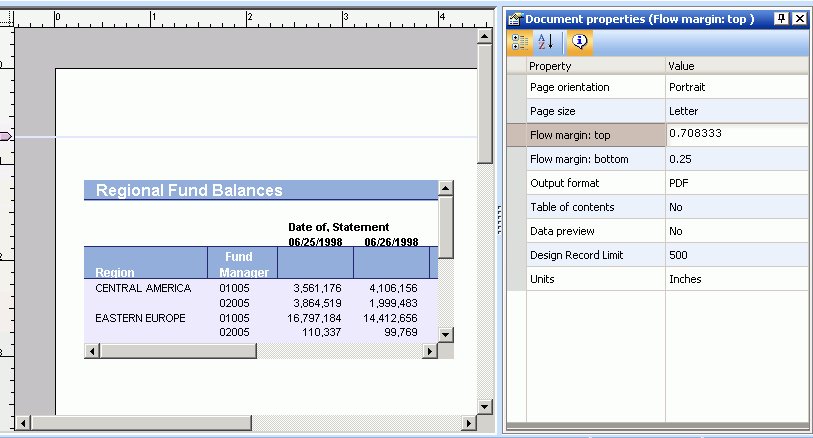
Procedure: How to Set Flow Margins for the Power Painter Canvas
You
can set the flow margins for the document, which become page margins
in the report output when Sizing and Overflow is set to Flowing
for the report. Flow margins are set through the top and bottom
margins, and flowing reports utilize flow margins to ensure that
header and footer information is preserved in the output.
Note: There
is currently no method of controlling horizontal overflow.
-
Select
the canvas from Power Painter.
-
From
the Document properties palette, manually type in the Flow
margin: bottom value.
The flow margin bottom value sets the ending vertical coordinate
where a flowing report ends on each page.
-
From the Properties window, manually
type in the Flow margin: top value.
The flow
margin top value sets the beginning vertical coordinate where a flowing
report starts on each new page.
or
You can also set flow margins on the
canvas. To display flow margins, select Layout from the toolbar
menu and select Show Flow Margins.
Note: Flow
margins are indicated by blue lines that appear on the top and bottom
of the Power Painter canvas.
-
Adjust
the objects on the canvas between the flow margins and run the report.
The report fills each page between the flow margins until
it reaches the end. For example, in the image below the flow margin
was adjusted so that an image could be used as a header.
Setting a Relative Position Between Objects in Power Painter
You can set a relative (vertical)
relationship between objects. Similar to the flowing report option,
you can select multiple report and graph objects and set a relationship.
The following relationship options are available from the main toolbar,
or from the Layout menu in Power Painter:
-
Relate objects. Sets the relative
relationship or distance between two objects; a surrounding object
(below) and the primary object (above) that precedes it.
-
Show relationships. Shows
or hides all relationships on the canvas.
Relative positioning is determined by setting where a surrounding
object's upper left corner is positioned relative to the lower left
corner of the preceding primary object.
Note: There is currently no method of setting horizontal relationships.
Procedure: How to Relate Surrounding Objects to a Report
A surrounding
object can only be related to one flowing report. However, a flowing
report can have multiple surrounding objects related to itself.
-
Select
a report or graph (surrounding) object from the Power Painter canvas.
-
Hold
down the Ctrl key while selecting a flowing report (primary) object that
precedes or is above the first selected object.
Note: The
primary object is indicated by solid black squares around the edges,
when selected. The surrounding object is indicated by clear squares
around the edges, when selected.
-
Set
the relationship between the objects by selecting the Relate
objects
 button
from the main toolbar.
button
from the main toolbar.
Note: The relationship buttons are only available
from the main toolbar when multiple objects are selected.
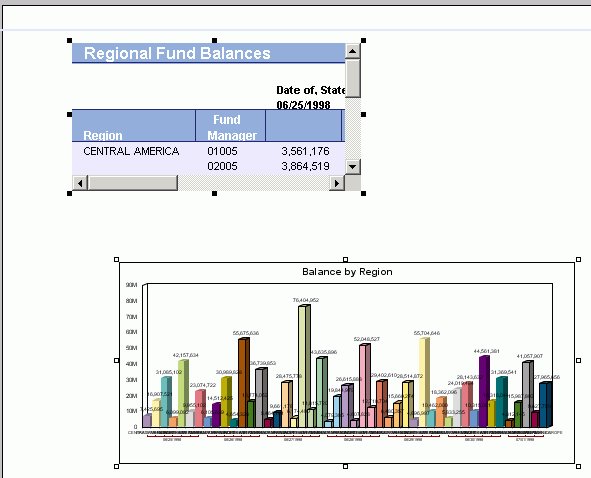
An
arrow appears on the canvas, indicating that the relationship has
been set.
In the following image, the graph is the surrounding
object to the report.
Tip: To
break the relationship, click the same surrounding objects using the
Shift key and click the Relate objects button
from the main toolbar. The arrow is removed and the relationship
is broken.
-
Run
the report.
Note: If
the document contains multiple reports, and the relationships have
been set, the first report runs until it is complete, followed by
the surrounding reports, at run time.
Note: If
the document contains a report and a graph, and the relationship
has been set, the report runs until complete, followed by the graph,
at run time.
Reference: Rules for Setting Relationships Between Objects
The
following rules apply when setting relationships between objects:
-
Setting Relationships
-
This sets a relative distance between the flowing report
and a surrounding object. The surrounding object is rendered immediately
following the end of a flowing report with the related distance
between the end of the flowing report and the beginning of the surrounding
object.
-
Fixed objects
-
A fixed object cannot be broken across a page break, it needs
enough vertical space to fit on the last page of the flowing report.
-
Flowing object (reports)
-
If a surrounding object is another flowing report, then the
required space does not need to be set. A flowing report can be
broken across pages. The reporting server determines if there is
enough room to begin rendering the surrounding flowing report.
-
Draw object
-
Relationships do not apply to draw objects such as images,
lines, and text. Draw objects can be placed above flowing reports
in a page layout, but draw objects placed below a flowing report
should be placed outside of the bottom flow margin.
-
Setting a relationship between a report and a graph
-
If the overflow property of the report is set to flowing
and there is no set relationship between the graph and report, then
the report will overlap and display on top of the graph at run time.
There is no way for Power Painter to automatically set relationships,
so you must set the relationship between the report and the graph.
Note: A
surrounding object can only be related to one flowing report; however, a
flowing report can have multiple surrounding objects related to itself.