WebFOCUS Online Help > Managed Reporting End User > Creating a Graph With Graph Assistant > Selecting Values for the X and Y Axes
In this section: How to: Reference: |
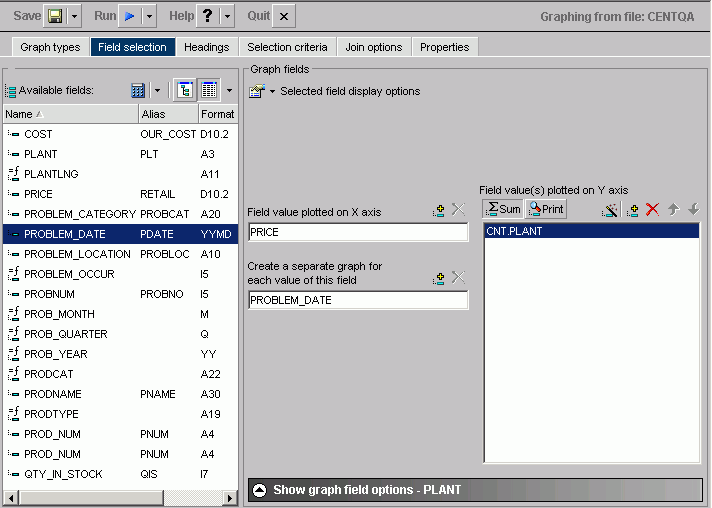
The values you select for the X- and Y-axes determine what data is included in the graph you are creating, and how it appears.
You can also:
You can search fields lists. For details, see Searching Field Lists.
Note: Field names that contain a hyphen "-" cannot be used in the HTML Graph Assistant.
To select the next set of fields, scroll to the bottom of the field list and select the Next option that appears. The Next option describes which fields will be returned, for example in the following image it shows that the next 201-400 fields of 417 will be retrieved:
To go back, scroll to the top of the field list and select the previous set of fields. For example, the following image shows the Previous option to select the previous 1-200 of 417 fields:
or
Click and hold the left mouse button, and drag the field to the Field value(s) plotted on Y-axis fields box.
or
Double-click a numeric field to automatically add it to the Y-axis fields box. Note that only numeric fields, which include decimal, floating point, and other formats, are added to the Y-axis.
Press Alt+C to go the Field value(s) plotted on Y-axis fields box. Then press Alt+M to go to the Available Fields window, tab to the field, and press Enter to add the chosen field.
To add more than one field name at a time:
Note: The display field(s) determines the vertical Y-axis of the graph. When the number of Y-axis labels is greater than one, the labels do not appear along the Y-axis. Instead, they appear in a legend that provides the names of the fields being graphed.
or
Click and hold the left mouse button, and drag the field to the Field value(s) plotted on X-axis fields box.
or
Double-click a non-numeric or date field to automatically add it to the X-axis fields box. Note that only non-numeric fields, which are typically in alphanumeric format, and date fields are added to the X-axis.
Press Alt+S to go the Field value(s) plotted on X-axis fields box. Then press Alt+M to go to the Available Fields window, tab to the field, and press Enter to add the chosen field.
You can hide the display of a Y-axis field in a graph. This option is useful when you want to temporarily remove a particular Y-axis field while retaining all of the original graph properties.
To hide a Y-axis field temporarily, use the Make this field invisible check box located on the subtab of the Show graph field options of the Field Selection tab. By default, the check box is not selected for each Y-axis field. If there are no Y-axis fields, the Show graph field options subtab is disabled.
You can assign a characteristic for each Y-axis field in your graph. In the following table, the first column lists the prefix operators or characteristics, and the second column lists their descriptions.
|
Summary Type |
Description |
|---|---|
|
Field_Name |
(Plain field value) |
|
ASQ |
Average Square |
|
AVE |
Average |
|
CNT |
Count |
|
FST |
Show first in group |
|
LST |
Show last in group |
|
MAX |
Maximum |
|
MIN |
Minimum |
|
PCT |
Percentage |
|
PCT.CNT |
Count Percentage |
|
RPCT |
Row Percentage |
|
TOT |
Total |
The field name in the Field value(s) plotted on Y-axis fields box is updated with the appropriate prefix. For example, if you have a field named SEQ_NO, and you select the Average Square summary type, the field name changes to ASQ.SEQ_NO.
| WebFOCUS |