WebFOCUS
Online Help > Managed Reporting Developer > Creating Graphs With Advanced Graph Assistant > Adding and Editing Labels in a Graph
Adding and Editing Labels in a Graph
In this section: How to: Reference: |
Adding labels to your graph helps provide important
information about what the data in your graph represents. The labels
you can add to your graph include chart titles, chart subtitles,
and chart footnotes. You can also style legend text, horizontal
X-axis, and vertical Y-axis labels to enhance the meaning of your
graph. For details on styling your graph, see Applying Custom Styling to a Graph.
All labels that you add or change are displayed in the graph
preview area immediately. Additionally, you can add FOCUS titles
(heading, footing), but they are not displayed in the graph preview
area.
Note: When you add a graph to a report in the Document
Composer, if the graph contains FOCUS titles, they are automatically
removed from the graph. To utilize titles in a graph you intend
to add to the Document Composer, use the Advanced Graph Assistant to
create graph titles (chart title, chart subtitle, chart footnote).
You can also add text objects to a graph in the Document Composer
and position them to function as a heading or footing.
Reference: Location of Labels in Graph Output
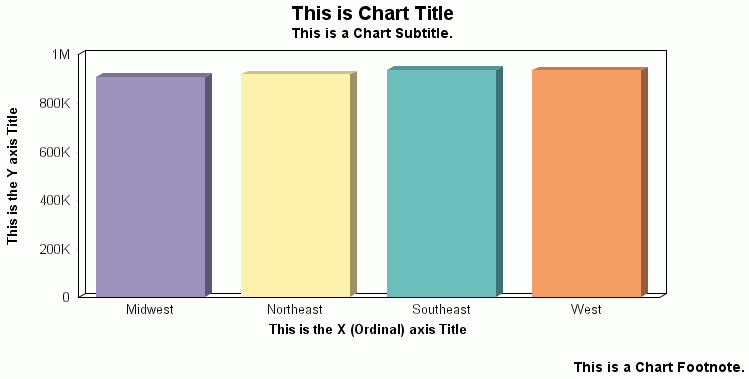
The
following image illustrates where titles, subtitles, footnotes, and
data (axis) titles appear in graph output.

Note
that all of the text in the graph image above is displayed in the
default format. None of the text has had any additional formatting
applied.
Procedure: How to Add a Title to a Graph
-
Click
the Chart editor tab.
-
In the
Titles folder, click the Title form.
The Title chart editing form appears below the graph preview area.
-
Double-click
the Value column in the row that displays Chart title in the Property
column.
The cursor is now positioned in the Value column.
-
Type
the desired text for the title.
The new title appears in the graph preview area.
Procedure: How to Add a Subtitle to a Graph
-
Click
the Chart editor tab.
-
In the
Titles folder, click the Subtitle form.
The Subtitle chart editing form appears below the graph
preview area.
-
Double-click the Value column area
to the right of Chart subtitle in the Property column.
The cursor
is now positioned in the Value column.
-
Type
the desired text for the subtitle.
The new subtitle appears in the graph preview area.
Procedure: How to Add a Footnote to a Graph
-
Click
the Chart editor tab.
-
In the
Titles folder, click the Footnote form.
The Footnote chart editing form appears below the graph
preview area.
-
Double-click
the Value column area to the right of Chart footnote in the Property
column.
The cursor is now positioned in the Value column.
-
Type
the desired text for the footnote.
The new footnote appears in the graph preview area.
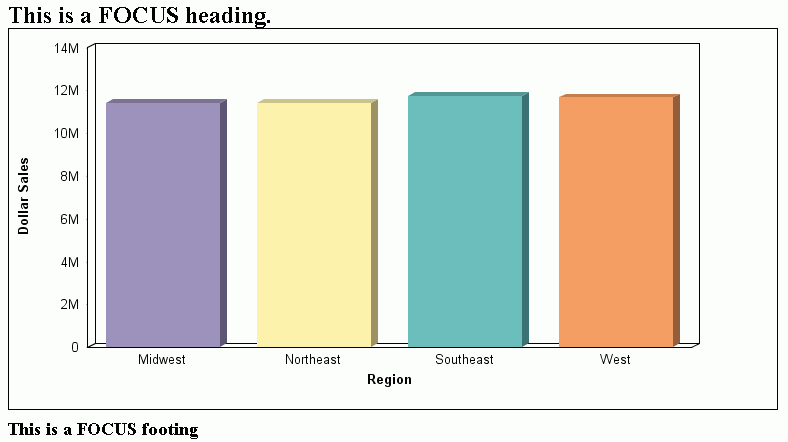
Reference: Location of the FOCUS Heading and Footing in Graph Output
The following image illustrates where the FOCUS
heading and footing appear in graph output.

Note
that the heading and footing are not displayed in the graph preview
area, only in the graph output.
Procedure: How to Add a FOCUS Heading and Footing to a Graph
-
Click
anywhere on the chart displayed in the graph preview area.
or
Click the Chart
 icon
in the query pane below the Available Fields tab.
The Chart
Properties form is displayed below the graph preview area.
-
Click
anywhere in the Value column to the right of where Heading or Footing
is listed in the Property column of the Chart Properties form.
A browse button (...) appears in place of the space you
just clicked.
-
Click
the browse button.
The Heading or Footing drill down dialog box opens, depending
on the property you selected.
-
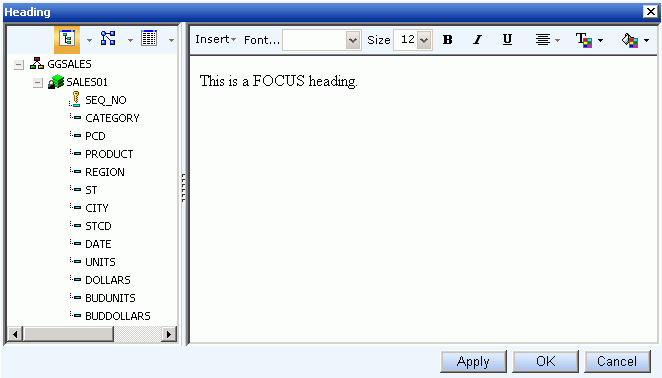
Type
and style text in the text area of the right pane, as shown in the following
image.

You
can also add data fields from the left pane to the text in the right pane.
-
Click OK.
Creating a Multi-line Title, Subtitle, or Footnote
You can create a multi-line chart title, chart subtitle, or chart
footnote by adding a new line when editing the text used to create
or modify one of these labels. For example, to create the following
chart title:
1st line of chart title
2nd line of chart title
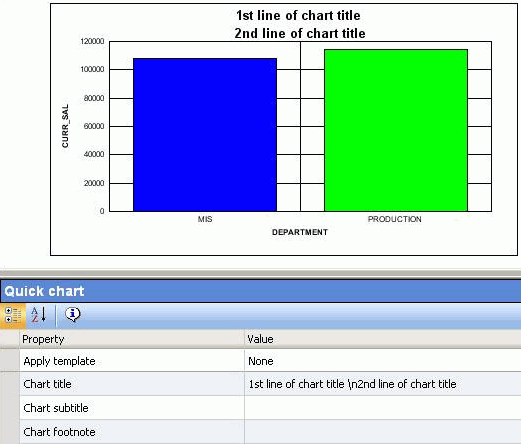
Enter the following string into the Chart title text box in the
Quick chart editing form:
1st line of chart title \n2nd line of chart title
The following image shows the result of adding \n to the Chart
title text to create a new line, which is displayed in the graph
preview area.

Note: When opening previously created requests that contain
multi-line text, \n is already added in the text box to indicate
a new line in the text string.
Procedure: How to Add Multi-line Text to a Title, Subtitle, or Footnote
-
To create
a new line in the text used for a chart title, chart subtitle, or
chart footnote, click the Chart editor tab.
-
In the
Chart folder in the left pane, click Quick chart.
-
Double-click
the Value column in the row that displays Chart title, Chart subtitle,
or Chart footnote in the Property column.
The cursor is now positioned in the Value column.
-
Type
the desired text for the selected title, subtitle, or footnote,
and insert \n immediately preceding the text where a new line is
needed.
The selected title, subtitle, or footnote text that spans
two lines appears in the graph preview area.
Editing Vertical (Y-axis) and Horizontal (X-axis) Data Labels
Vertical (Y-axis) and horizontal (X-axis) graph labels
are placed on the graph according to the data fields used to create
the graph. The data labels that appear on the graph are the same
names listed for the data fields added to the query pane, which
originate in the Master File for the selected data source.
The horizontal (X-axis) labels of a graph are determined by the
sort fields selected. You can edit each X-axis title using the Field
properties form, which is displayed below the graph preview area
when you select an X-axis field in the query pane below the Available
Fields tab. You can also edit X-axis titles using the Chart Editor.
For details see How to Edit Horizontal (X-axis) Data Labels in the Field Properties Form.
The vertical (Y-axis) labels of the graph are determined by the
numeric display fields selected. You can edit each Y-axis title
using the Field properties form, which is displayed below the graph
preview area when you select a Y-axis field in the query pane below
the Available Fields tab. You can also edit Y-axis titles using
the Chart Editor. For details see How to Edit the Vertical (Y-axis) Data Labels in the Field Properties Form.
Note: When the number of Y-axis fields is greater than
one, the labels do not appear along the Y-axis. Instead, the labels
for the Y-axis appear in a legend, located below the X-axis, that
provides the names of the fields being graphed. However, you can
still add a title to the Y-axis, even when the Y-axis labels are
displayed in a legend, by using the Y-axis title field in the Y1
axis form of the Chart Editor.
Procedure: How to Edit Horizontal (X-axis) Data Labels in the Field Properties Form
To
edit X-axis data labels using the Field properties form:
-
Click
the Data selection tab.
-
Click
the desired X-axis field in the query pane below the Available Fields tab.
The Field properties form for the selected X-axis field
appears below the graph preview area.
-
Double-click
the Value column area to the right of Title in the Property column.
Your cursor is now positioned in the Value column at the
end of the existing label.
-
Edit
the text for the X-axis label.
The edited X-axis label appears in the graph preview area.
Procedure: How to Edit Horizontal (X-axis) Data Labels in the Chart Editor
-
Click
the Chart editor tab.
-
In the
Ordinal axis folder, click the Title form.
The Title editing form for the X-axis appears below the
graph preview area.
-
Double-click
the Value column area to the right of X-axis title in the Property
column.
Your cursor is now positioned in the Value column at the
end of the existing label.
-
Edit
the text for the X-axis label.
The edited X-axis label appears in the graph preview area.
Procedure: How to Edit the Vertical (Y-axis) Data Labels in the Field Properties Form
To edit Y-axis
data labels using the Field properties form:
-
Click the Data selection tab.
-
Click the desired Y-axis field in the
query pane below the Available Fields tab.
The Field
properties form for the selected field appears below the graph preview
area.
-
Double-click the Value column area
to the right of Title in the Property column.
Your cursor
is now positioned in the Value column at the end of the existing label.
-
Edit
the text for the Y-axis label.
The edited Y-axis label appears in the graph preview area.
Procedure: How to Edit the Vertical (Y-axis) Data Labels in the Chart Editor
-
Click
the Chart editor tab.
-
In the
Y1 axis folder, click the Title form.
The Title editing form for the Y-axis appears below the
graph preview area.
-
Double-click
the Value column area to the right of Y-axis title in the Property
column.
Your cursor is now positioned in the Value column at the
end of the existing label.
-
Edit
the text for the Y-axis label and the edited Y-axis label appears
in the graph preview area.


 icon
in the query pane below the Available Fields tab.
