WebFOCUS
Online Help > Managed Reporting End User > Creating a Graph With Graph Assistant > Displaying Missing Data Values in a Graph
Displaying Missing Data Values in a Graph
You can display missing data values (in a bar graph,
line graph, area graph, or any variation of these graph types) in
one of the following formats:
-
Graph as zero. In
bar graphs, a bar appears on the zero line. In line graphs, a solid
line connects the missing value with the succeeding value. In area graphs,
the area appears on the zero line.
-
Graph as gap. In
all graph types (bar, line, or area), missing values appear as a
gap in the graph.
-
Dotted line to zero. In
line graphs, a dotted line connects the missing value with the succeeding
value. In 3D bar graphs, solid lines outline the flat bar corresponding
to the missing value. In 2D bar graphs, a gap appears in the graph.
In area graphs, a transparent area extends down to the zero line
and then up to the succeeding value.
-
Interpolated dotted line. In
a line graph, missing values appear as an interpolated dotted line
that connects the plot points immediately preceding and succeeding
the missing value. In bar and area graphs, missing values display
as an interpolated (transparent) bar or area.
Procedure: How to Display Missing Values in a Graph
-
In the Graph Assistant, click the Properties tab.
-
Click the Y-axis subtab.
-
From
the Missing values display list box, select one of the following values:
- Graph as zero.
- Graph as gap.
- Dotted line
to zero.
- Interpolated
dotted line.
Reference: Displaying Missing Values as Zero in a Graph
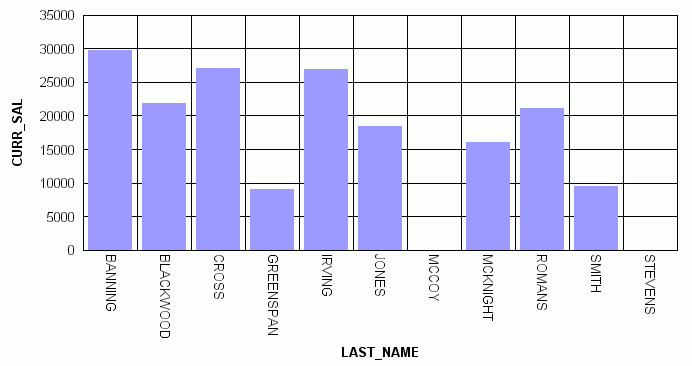
The
following image illustrates how missing values are represented in
a bar graph when designated to appear as zero. The CURR_SAL values
for McCoy and Stevens are missing.

Reference: Displaying Missing Values as a Gap
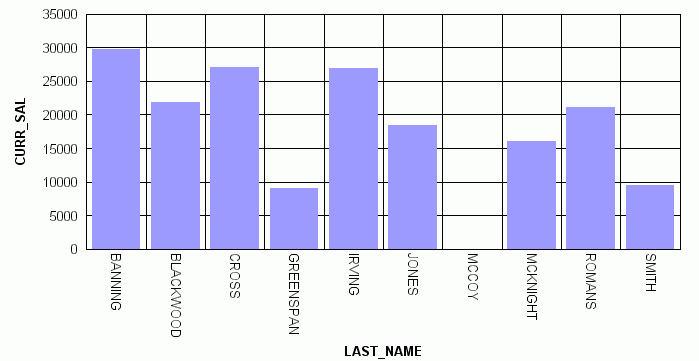
The
following image illustrates how missing values are represented in
a bar graph when designated to appear as a gap. The CURR_SAL value
for McCoy is missing.

Reference: Displaying Missing Values as a Dotted Line to Zero
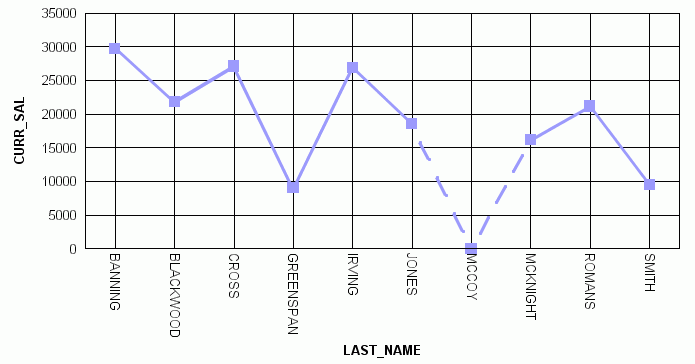
The
following image illustrates how missing values are represented in
a line graph when designated to appear as a dotted line to zero.
The CURR_SAL value for McCoy is missing.

Reference: Displaying Missing Values as an Interpolated Dotted Line
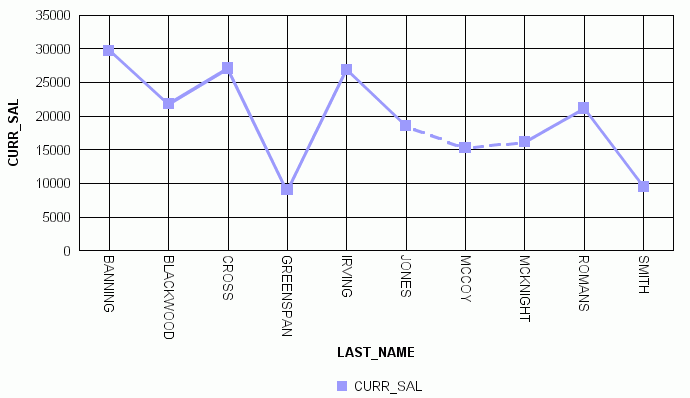
The
following image illustrates how missing values are represented in
a line graph when designated to appear as an interpolated dotted
line. The CURR_SAL value for McCoy is missing.
