WebFOCUS Online Help > Managed Reporting End User > Using Dashboard > PowerPoint Integration With Dashboard
In this section: |
PowerPoint integration with WebFOCUS provides users with a method of exporting Dashboard reports and graphs into the PowerPoint application. PowerPoint options appear as an icon in a Launch block and present users with choices for exporting reports and graphs into new and existing PowerPoint presentations. When exporting to PowerPoint, reports retain their styling, and graphs can be output as a static image or a live graph, which is an MSChart object.
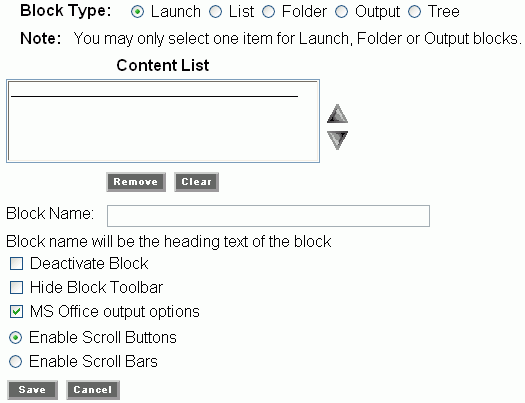
From the Add Block or Edit Block page, a developer can add the MS Office output options only to a Launch block. The MS Office output options check box, which represents the PowerPoint options, is grayed out (unavailable) for other block types and when the Launch block contains Report Library content. The PowerPoint options are available for any Launch block created for a Public View, Group View, or a user's My View. The Dashboard page where you can add the MS Office output options is shown in the following image:
Note:
A report can be exported from Dashboard to PowerPoint as a new presentation. A new file is created, the report is placed in the first slide, and the styling is retained.
A static graph can be exported from Dashboard to PowerPoint as a new presentation. A new file is created and the graph is placed in the first slide as an image of the graph output. Note that the datasheet object is not populated with graph data.
A live graph is the term used to describe an MSChart object that stores data in the datasheet object, which makes it possible to manipulate data in a graph. Live graphs can be exported from Dashboard to PowerPoint with the following menu options:
When you export a live graph, you can select from the following list of graph types: Clustered Column, 3D Clustered Column, Clustered Bar, 3D Clustered Bar, Line, Line with Markers, 3D Line, Pie, 3D Pie, Clustered Cylinder Column, Clustered Cylinder Bar, Clustered Cone, Clustered Cone Bar, Clustered Pyramid, and Clustered Pyramid Bar.
The following procedure assumes that a developer has already added the MS Office output options to the launch block where your live graph is stored in Dashboard.
The PowerPoint Options pop-up menu appears, as shown in the following image.
If you selected Open existing presentation, use the dialog that appears to browse your desktop and select an existing PowerPoint file, then in the dialog that appears, use the Object Insertion Position drop-down list to select New Slide, or an existing slide if you want to overlay existing content, and click OK.
Because WebFOCUS utilizes ActiveX to integrate PowerPoint and Internet Explorer, you have to adjust your browser security settings to use the PowerPoint ActiveX control.
Note: PowerPoint (MS Office output option) is only supported with an Internet Explorer browser. Firefox and other browser types are not supported.
| WebFOCUS |