WebFOCUS
Online Help > InfoAssist > Customizing and Styling Report Queries > Styling Report Queries
You can apply custom styling to specific areas of a
report query. When creating a report query in InfoAssist, you can
perform the following styling customizations:
Procedure: How to Style Data and Column Titles in a Report
You
can style data, column titles, or both in the report output for
the selected data source field.
-
Select the desired data source field in the Query Design pane.
The Field tab is displayed in the Control Panel.
-
Select one of the following in the Style menu:
- Data Style - To style only the data for the selected
data source field.
- Title Style - To style only the column title for the selected
data source field.
- Data + Title - To style both the data and the column title
for the selected data source field.
-
Select any of the following styling options that are available
in the Style menu:
- Font type - Use the drop-down menu to change the
font type.
- Font size - Use the drop-down menu to change the numeric
value for the font size.
- Text justification - Click the Justify Left, Justify Center,
or Justify Right icon to justify the text.
- Font styling - Click the Bold, Italic, or Underline icon
to style the selected font.
- Font color - Click the Font Color icon to open the Color
dialog where you can select the font color.
- Background color - Click the Background Color icon to open
the Color dialog where you can select the background color.
Procedure: How to Style Headings and Footings in a Report
You
can style headings and footings in the report output for the selected
heading or footing field.
-
Highlight the desired heading or footing text in the Query Design
pane.
The Home tab is displayed in the Control Panel.
-
Click the Style menu.
The Style dialog box opens.
-
Select any of the following styling options that are available
in the Style dialog box:
- Font type - Use the drop-down menu to change the
font type.
- Font size - Use the drop-down menu to change the numeric
value for the font size.
- Text justification - Click the Justify Left, Justify Center,
or Justify Right icon to justify the text.
- Font styling - Click the Bold, Italic, or Underline icon
to style the selected font.
- Font color - Click the Font Color icon to open the Color
selection dialog where you can select the font color.
- Background color - Click the Background Color icon to open
the Color dialog where you can select the background color.
- Reset styles - Click the Resetting styles icon to reset
to the default styles from the template.
Procedure: How to Style Rows of Data With Alternating Colors in a Report
You
can style rows of data with alternating colors in the report output
for the selected data source field.
-
Select the Home tab on the Control Panel.
-
Select Banded in the Report menu.
The Color selection dialog box opens, as shown in the following
image.
The following image shows the color selection dialog,
which is used throughout InfoAssist.
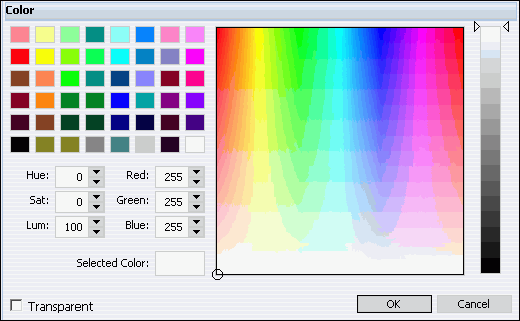
-
Click a color square on the left side of the dialog box or
click an area of the color palette on the right side of the dialog
box.
You can also select colors by typing numbers in the Hue,
Sat, Lum, Red, Green, and Blue fields or using the up and down arrows
next to each field to set numeric values.
Note: Make
sure the selected color appears in the Selected Color field and
the Transparent check box is not selected.
-
Click OK.
-
Run the report.
The
selected color provides an alternating color scheme for the report.
The report output will display alternating rows of data using a
white background for one row and a background of the selected color
in the next row. This pattern continues throughout the report, as
shown in the following image.
Procedure: How to Apply Traffic Light Conditional Styling to Data in a Report
You
can apply conditional traffic light styling to data displayed in
the report output for a selected numeric measure field. By default,
the first condition displays values in green and the second condition
displays values in red.
-
Select the desired numeric measure data source field in the Query
Design pane.
The Field tab is displayed in the Control Panel.
-
Select Traffic Lights from the Specific menu.
The Traffic Light Condition dialog box opens displaying
the green light selection fields where you can select and enter
green light criteria.
-
From the drop-down menu below the selected data source field
name, choose one of the following relational operators:
- Equal to
- Not equal to
- Greater than
- Less than
- Greater than or equal to
- Less than or equal to
-
In the field to the right of the operator drop-down menu, enter
the desired value for the selected operator to display data values
in green in the report output for the selected data source field.
or
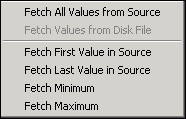
Select an option from the Values drop-down menu
and select the desired data value in the Data Values dialog box
that opens. From the Values drop-down menu, as shown in the following
image, you can select Fetch All Values from Source, Fetch Values from
Disk, Fetch First Value in Source, Fetch Last Value in Source, Fetch
Minimum, or Fetch Maximum.
-
Click Add New.
The red light selection fields are displayed in the Traffic
Light Condition dialog box where you can select and enter red light
criteria.
-
From the red light drop-down menu, choose the desired relational operator.
-
In the field to the right of the red light drop-down menu,
enter the desired value for the selected operator to display data
values in red in the report output for the selected data source
field.
or
Select an option from the Values drop-down menu
and select the desired value in the Data Values dialog box that
opens.
-
Perform any of the following options in the Traffic Light Condition
dialog box:
- Delete an
existing traffic light condition by clicking the Remove button.
- Perform styling
and change colors by clicking the Style button.
In the Style pop-up menu that opens, clicking the color
 icon opens
the color selection dialog box where you can select a different
color than the default green and red colors that appear for the
first two conditions. When selecting colors, you can click a color
square on the left side of the dialog box or click an area of the
color palette on the right side of the dialog box. You can also
select colors by typing numbers in the Hue, Sat, Lum, Red, Green,
and Blue fields or by using the up and down arrows next to each
field to set numeric values.
icon opens
the color selection dialog box where you can select a different
color than the default green and red colors that appear for the
first two conditions. When selecting colors, you can click a color
square on the left side of the dialog box or click an area of the
color palette on the right side of the dialog box. You can also
select colors by typing numbers in the Hue, Sat, Lum, Red, Green,
and Blue fields or by using the up and down arrows next to each
field to set numeric values.
- Add more
traffic light conditions by clicking Add New and
selecting a different color for each new condition that you add.
-
Click OK when you are ready to
close the Traffic Light Condition dialog box.
-
Run the report.
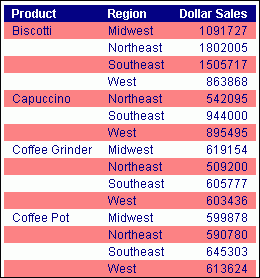
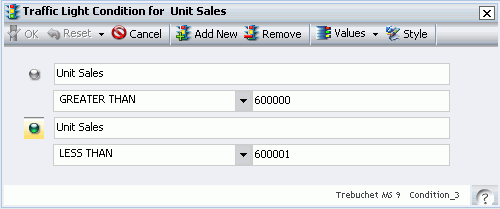
The
following image shows the Traffic Light Condition dialog box with
criteria to display report output showing Unit Sales greater than
600000 in green and Unit Sales less than 600001 in red.
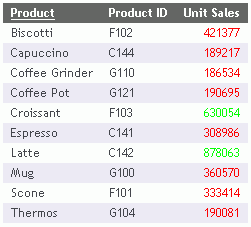
The following image
shows the resulting report output that has traffic light conditional styling
applied to the data in the Unit Sales column using red and green
text according to the criteria specified in the Traffic Light Condition
dialog box.
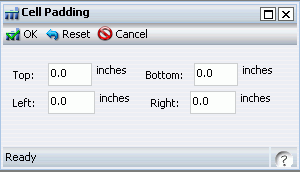
Procedure: How to Utilize Cell Padding in a Report
You
can customize the amount of space inserted between rows and columns
in a report.
-
Select the Layout tab in the Control Panel.
-
Select Custom from the drop-down menu
for the Cell Padding button in the Report Menu.
The Cell Padding dialog box opens.
-
Specify the desired cell padding values in the Top, Bottom,
Left, and Right fields.
-
Click OK.
Selecting
the Cell Padding button opens the Cell Padding dialog box, as shown
in the following image, where you can set specific values to control
the amount of space inserted between rows and columns in a report.