WebFOCUS Online Help > InfoAssist > Using the InfoAssist Application Window > Understanding the Results Panel
In this section: |
As you create or modify a query, the Results Panel displays the Layout Canvas in the default Interactive Design view or the Query Design pane when you select the Query Design view. When you execute a query, the Results Panel displays the Query Output window. If the output window is closed or there is no query to display a preview of, the Results Panel is blank. Note that you can select Query Design view or Interactive Design view from the Design menu of the View or Home tabs.
You can expand the size of the Results Panel by selecting Resources in the Application menu of the View tab. This minimizes the Resources Panel and expands the Results Panel to also occupy the area where the Resources Panel normally appears. You can also manually adjust the size of the Results Panel and Resources Panel by clicking and dragging the border between the two panels in either direction. Hover the mouse cursor over the border and when it changes into a two-way arrow, click and drag the border.
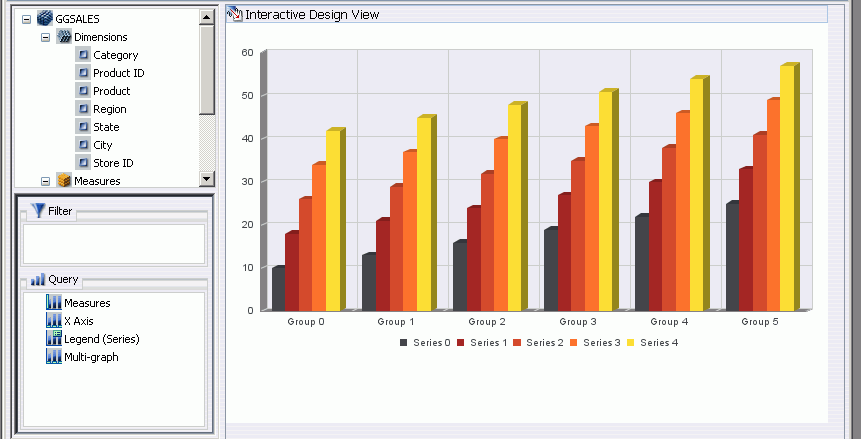
The following image shows the Results Panel displaying a chart preview when first entering InfoAssist to create a chart query. The Resources Panel appears to the left of the Results panel.
After executing a query to generate output, if you minimize or close the Query Output window, the Results Panel displays empty space, as shown in the following image.
The Query Design pane displays the Filter area, Query field containers, and heading and footing text fields in the Results Panel when Query Design view is selected. The Query Design pane displays in the Resources Panel below the Data pane when the default Interactive Design view is selected. Note that heading and footing text fields are not available in the Query Design pane when it is displayed in the Resources Panel in Interactive Design view.
The Results Panel provides a larger viewing area for displaying the Query Design pane, which is useful when designing a query with multiple filters, numerous fields, or optional heading and footing text fields. You can select Query Design view or Interactive Design view from the Design menu of the View or Home tabs.
The following image shows the Query Design pane in the Results Panel of the InfoAssist application window displaying report query field containers that include Report Heading, Page Heading, Filter, Column Labels (ACROSS), Row Labels (BY), Measures (SUM), Page Footing, and Report Footing.
Any of the heading and footing fields can be expanded by clicking
the expansion  button. The following image shows
the Report Heading field expanded in the Query Design pane.
Depending on whether a report or chart query is being created, the Query Design pane displays selected data source fields using different types of field containers. For reports, the Query Design pane displays Column Labels, Row Labels, and Measures field containers. For charts, the Query Design pane displays Legend, Categories, and Measures field containers, as shown in the following image.
The Layout Canvas displays a preview of the query being created or modified in the Results Panel when in the default Interactive Design view. To select Interactive Design view, go to the Design menu of the View or Home tabs and select Interactive. The Layout Canvas is always fully maximized (within the Results Panel) and cannot be minimized, cascaded, or tiled. However, whenever no query exists, a blank canvas is displayed.
The Layout Canvas displays either live or sample data, depending on whether Data from Source (the default) or Use Sample Data is selected in the Response menu of the Home tab. When Data from Source is selected, a live preview of the query being built is refreshed in the Layout Canvas as you add and remove data source fields in the query. When Use Sample Data is selected, the Layout Canvas displays sample data (from the Master File) using the same formatting and styling used to display live data.
The following image shows a preview of a report query displayed in the Layout Canvas in Interactive Design view.
When a query is run, the output is displayed either as a query output window in the Results Panel or in a new browser window. Multiple output windows can be created and displayed in several different ways depending on the following options, which you can select in the Output Window menu of the View tab.
Output window and tab options are also available in the Status Bar, and output window display options are also available in the Navigation Taskbar.
The following are output target options you can select.
Note: If you attempt to close a query displayed in the output window without saving, you are prompted to save, however, if you close a query displayed in a browser window, there is no prompt to save and the browser is closed.
The following are output view options you can select.
The Query Output window can display query output in any of the supported formats, which include HTML, PDF, Active Report, Active Flex, Excel, and PowerPoint. The following image shows HTML report output, which is the default output format, as displayed in the Query Output window with the Resources Panel displayed to the left.
The following image shows report output displayed in the Query Output window.
The following image shows Active report output displayed in the Query Output window.
The following image shows Active Flex output displayed in the Query Output window. The drop-down menu is selected for the second column of data to expose the menu options.
The following image shows Excel report output displayed in the Query Output window.
The following image shows PowerPoint report output displayed in the Query Output window.
| WebFOCUS |