WebFOCUS Online Help > Managed Reporting End User > Creating a Graph With Graph Assistant > Applying Conditional Styling to a Graph
You can add further value to your graph by using conditional styling to highlight certain defined data with specific styles and colors.Conditional styling, also referred to as stoplighting, enables you to define conditions that determine when to apply particular fonts, point size, text style, foreground and background color, and drill down procedures to your report's data when the report is run.
For example, you can apply the color red to all departments that did not reach their sales quotas and apply the color black to all departments that did reach their sales quotas. In this example, the user can view quickly which departments did or did not reach their quotas. To examine how the results of one department may impact the results of a second department, you may want to provide a drill-down to a report that examines this possibility.
You can apply color to the following graph types:
Conditional styling is only supported for Y-axis values.
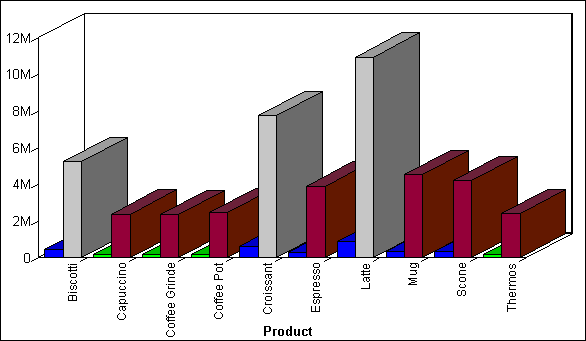
The following illustrates how you can apply conditional styling to a graph. In this example:
The output is shown in the following image:
| WebFOCUS |