WebFOCUS Online Help > InfoAssist > Creating and Customizing Chart Queries > Selecting a Chart Type
InfoAssist enables you to create the following types of chart queries:
You can create each of these chart types using any of the following output formats:
An example of each supported chart output format is shown on the following pages.
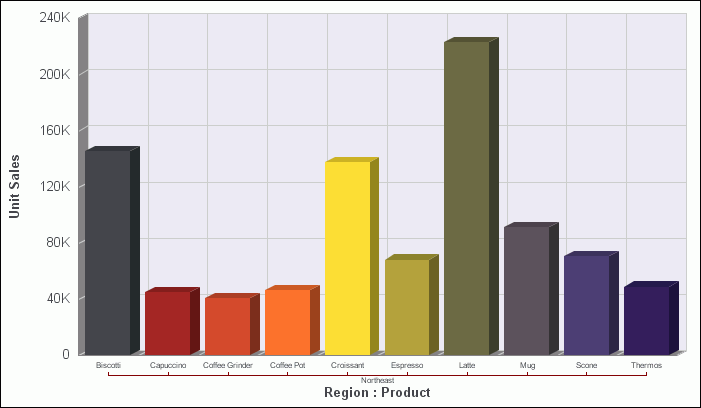
The following image is an example of a bar chart.
The following image is an example of a pie chart.
The following image is an example of a line chart.
The following image is an example of an area chart.
The following image is an example of a scatter chart.
| WebFOCUS |